
Green Energy Tech Insights
Utilities costs can have a huge impact on your business due to tariff price fluctuations, high energy and water consumption, or water leakages. To better manage the impact of utilities costs, GET Insights can help you plan and manage utilities consumption by leveraging big data and AI.
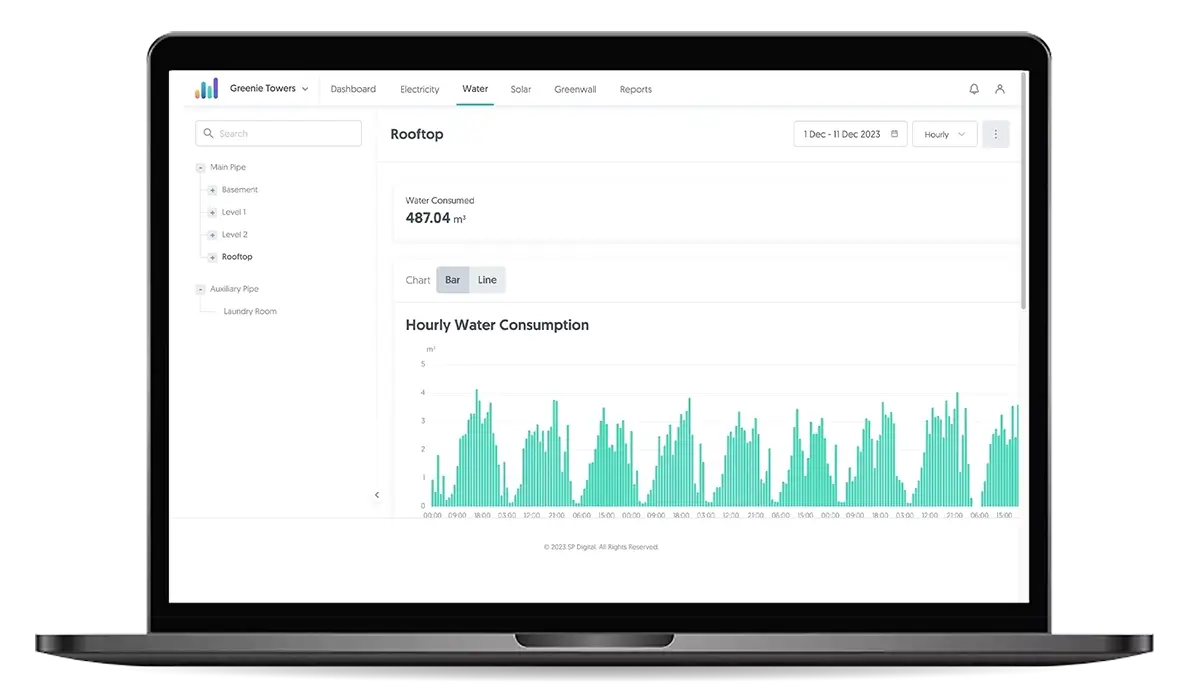
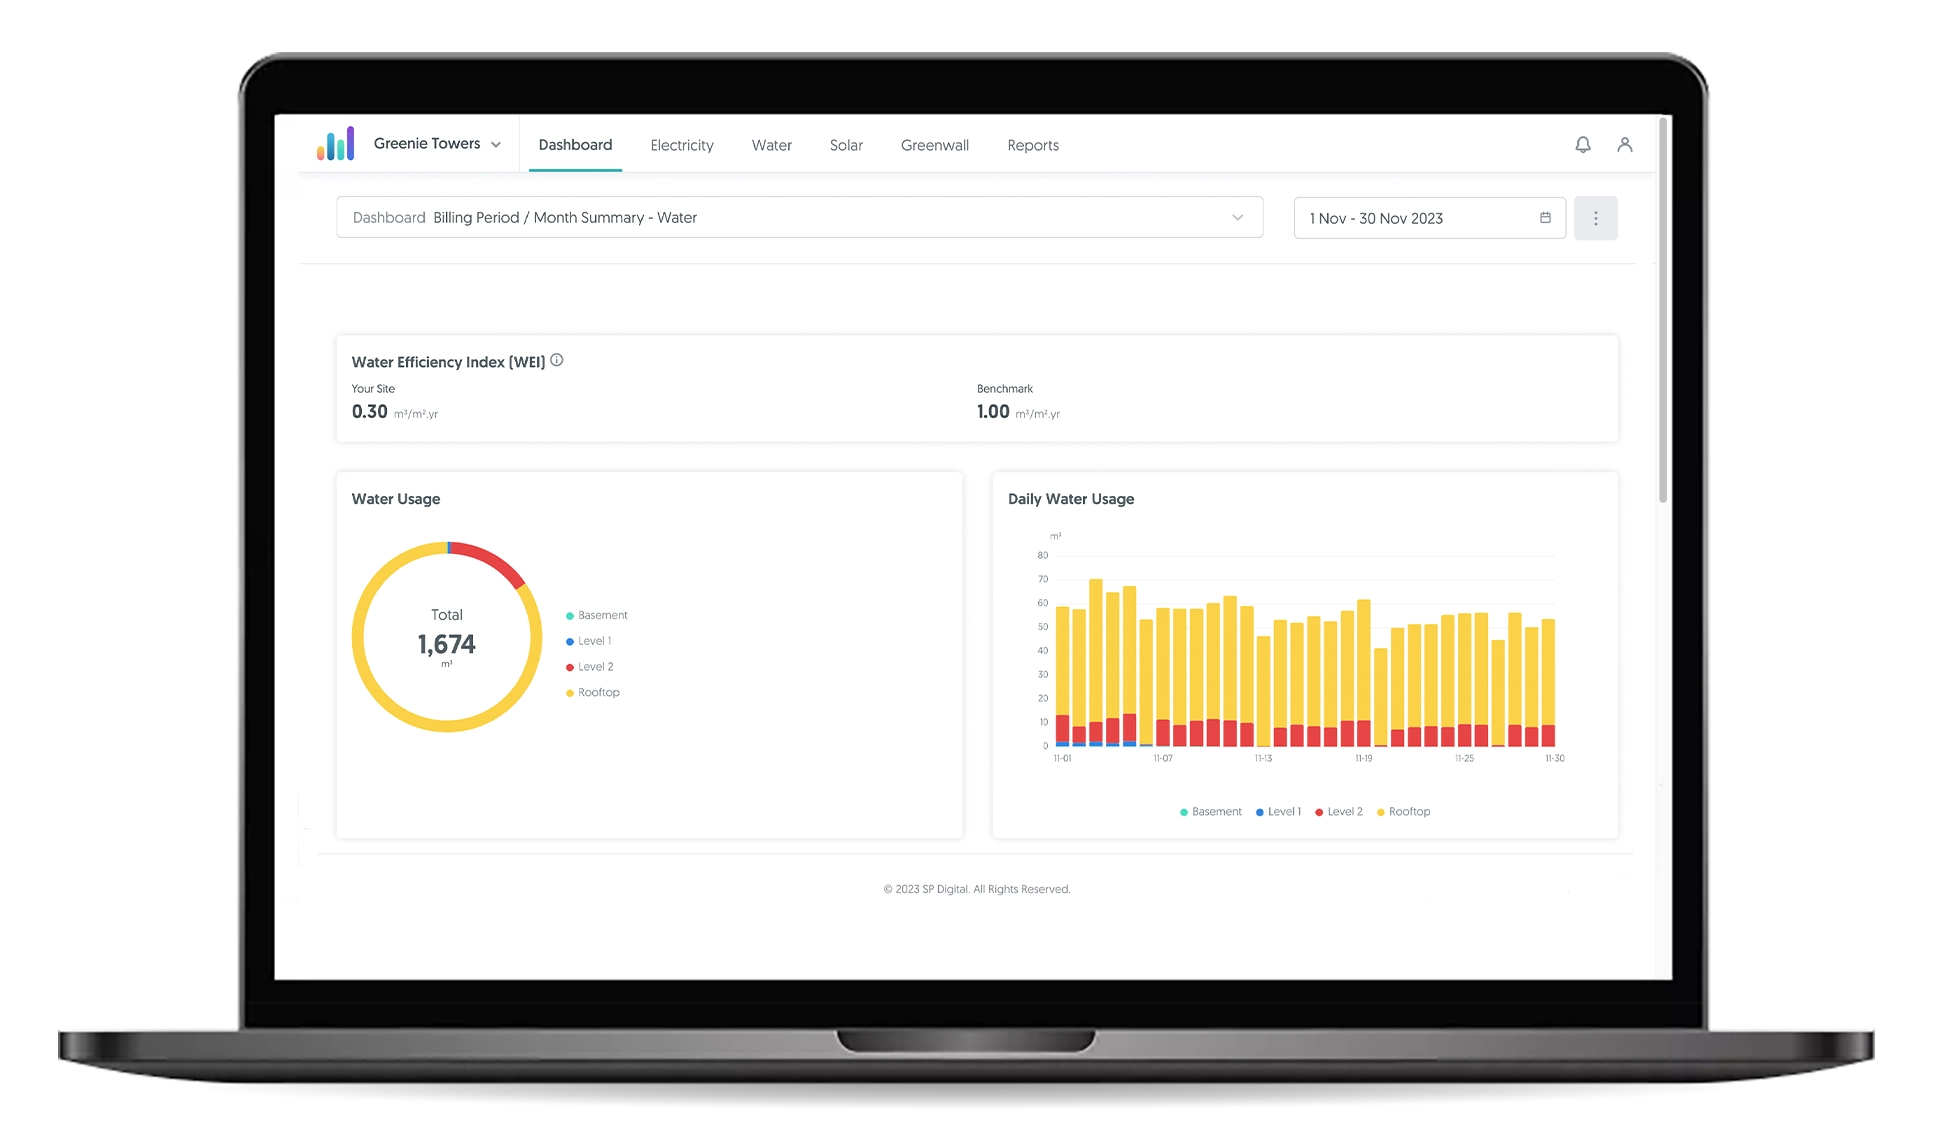
The utility monitoring and insights dashboard allows you to manage, monitor, report, analyse and optimise utilities usage, so that you can identify wastage and cost efficiencies to achieve sustainability targets.
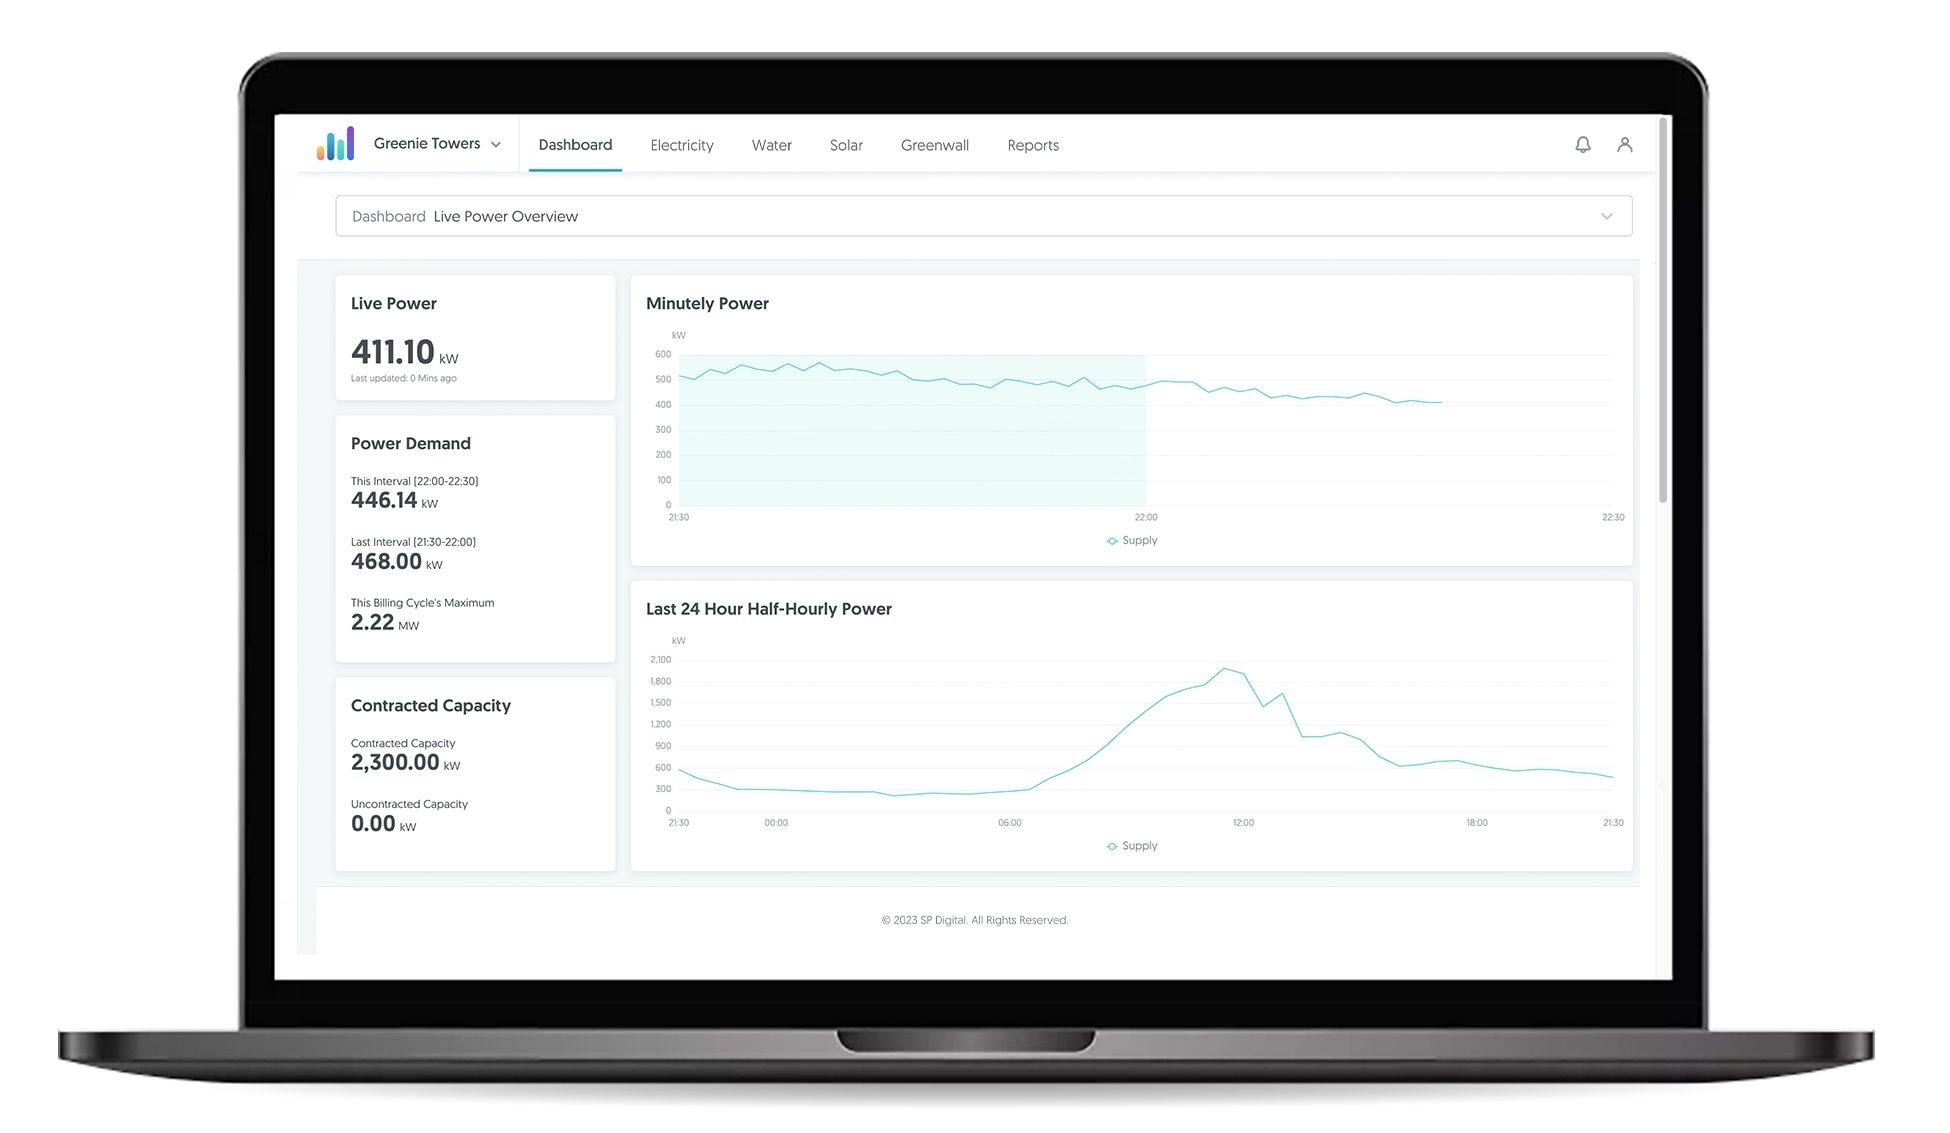
GET Insights also enables you to maximise the value of your distributed energy resources by monitoring energy generated from on-site renewable sources, such as solar panels, and receiving timely alerts to manage contracted capacity and grid constraints.

Key Benefits
Utilities Consumption Data
Review utilities data for deeper analysis and reporting
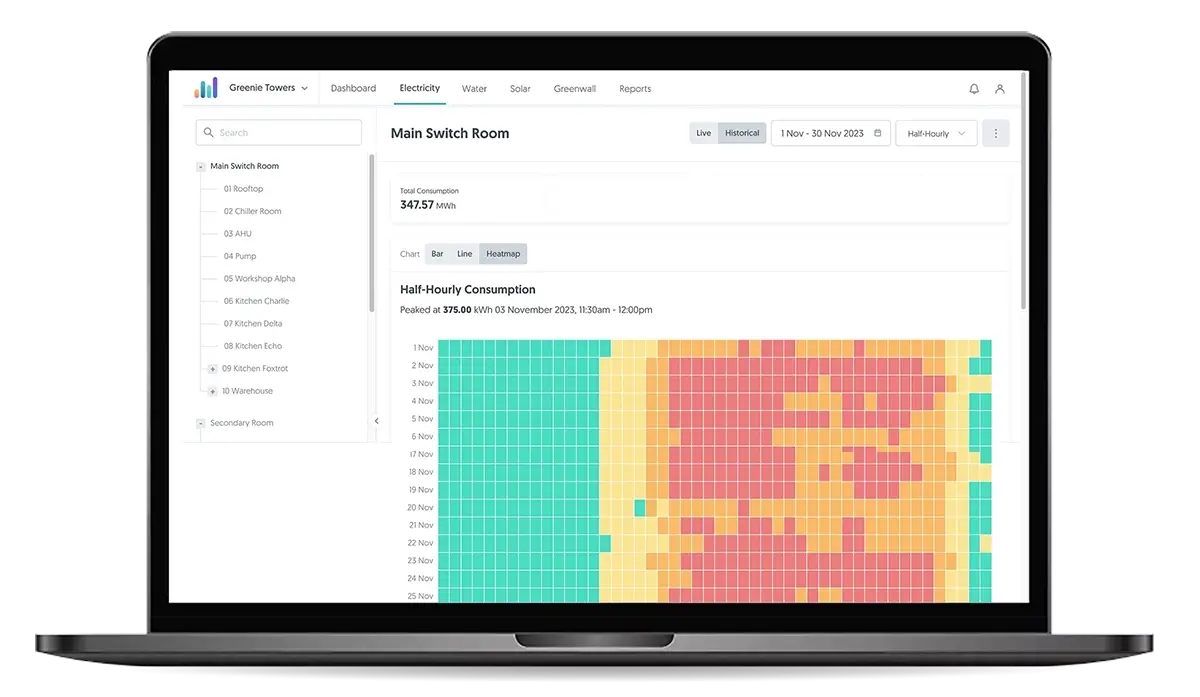
Trends and Insights
Analyse trends and glean insights with detailed visualisation of utilities consumption and renewable energy generated
Granular Asset Monitoring
Monitor key equipment to assess asset performance, health, and drive optimisations
Act proactively based on intelligent alerts
Define consumption thresholds and act on alerts when thresholds are exceeded
Anomaly Detection and Notification
Receive alerts on possible anomalies so you can investigate and fix issues quickly
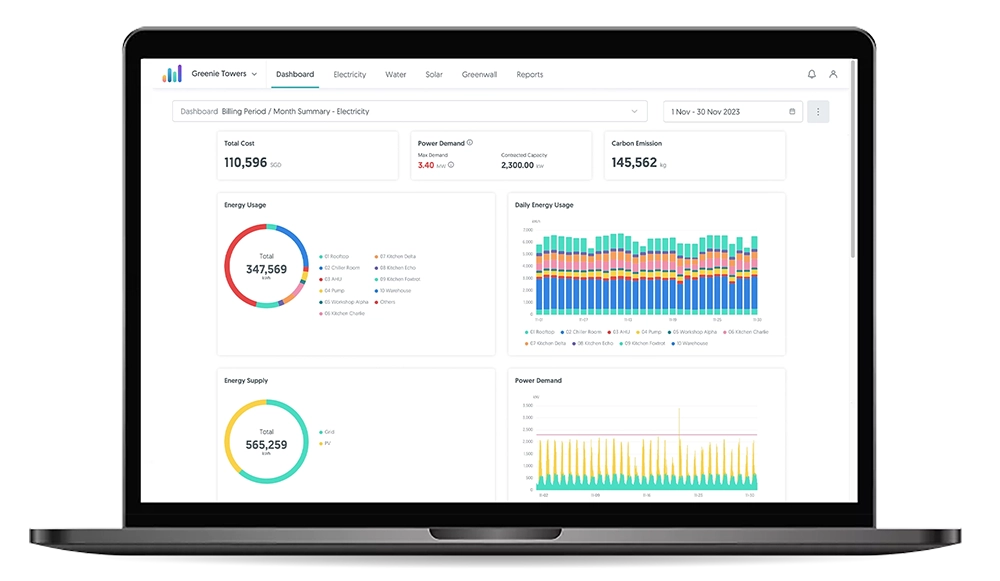
Improve Utilities Cost and Carbon Emissions Tracking and Management
With detailed data and analysis, improved organisational tracking and management of utilities costs and carbon emissions enable better control
Ease of Installation and Interfacing
Easily interface with existing systems and instruments or deploy wireless sensors to avoid disruption
GET Insights
now with 70% funding support
GET Insights is now an Advanced Digital Solution (ADS) project supported by the Infocomm Media Development Authority (IMDA) of Singapore.
Find out how you can enjoy funding support.
Eligible business entities:
- 1
ACRA-registered, taxable and operating in Singapore
- 2
Minimum 30% local shareholding
- 3
Group sales turnover not more than $100 million per year, or group employment size not more than 200 employees
GET® Insights from one utilities dashboard
Do you have a complete overview of your utilities consumption?
Manage utilities costs better with granular data on usage and possible anomalies. Watch video to learn more.
Bringing data from different systems, into one dashboard
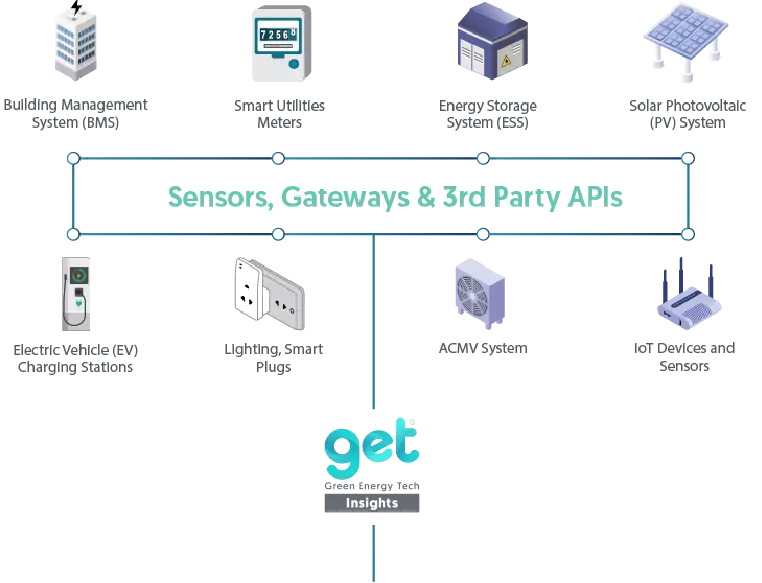
The smarter, simpler way to manage your utilities consumption
Centralised monitoring digital dashboard
- access the information anywhere, anytime
Easy-to-use interface
- gain insights at a glance with visualisation of live data charts
Early anomaly detection through data and AI
- improve rectification time and minimise cost implications
Timely alerts when utilities consumption exceeds defined thresholds
- prevent costly charges

Photo courtesy of Sembcorp Marine
In 2018, SP Digital deployed the GET Insights energy management system that helped Sembcorp Marine monitor a 4.5 MWp PV system (Photovoltaic system), 2 MWh ESS (Energy Storage System) and its electrical loads across their shipyard. This provided visibility to Sembcorp Marine’s energy management team in the in-depth performance of the PV system, ESS health and load patterns to better manage their energy usage, schedule maintenance and their work activities.
GET Insights also leveraged AI to forecast the load and automatically schedule the ESS battery system to charge and discharge to reduce the peak consumption from the grid. This helped Sembcorp Marine save on Uncontracted Capacity Charges (UCC) every month.
The project maintained a total of 10.8MWp upon completion.